
A few weeks ago we ran the numbers on what a nurse’s paycheck is really worth in all 50 states: sticker pay adjusted for what things actually cost. It is still the right first move, and the rankings still hold.
But it had a caveat buried in it, and that caveat turns out to be worth more money than the entire article: these are statewide medians.
Nurses already know this instinctively. Watch any online thread about where nursing pay goes furthest and you will see the same pattern. Somebody names a state, and within three replies four people are arguing about which part of that state, which system, and which contract. They are not nitpicking. They are circling the actual answer.
The biggest pay arbitrage in nursing is not between states. It is inside them.
The number that makes the case
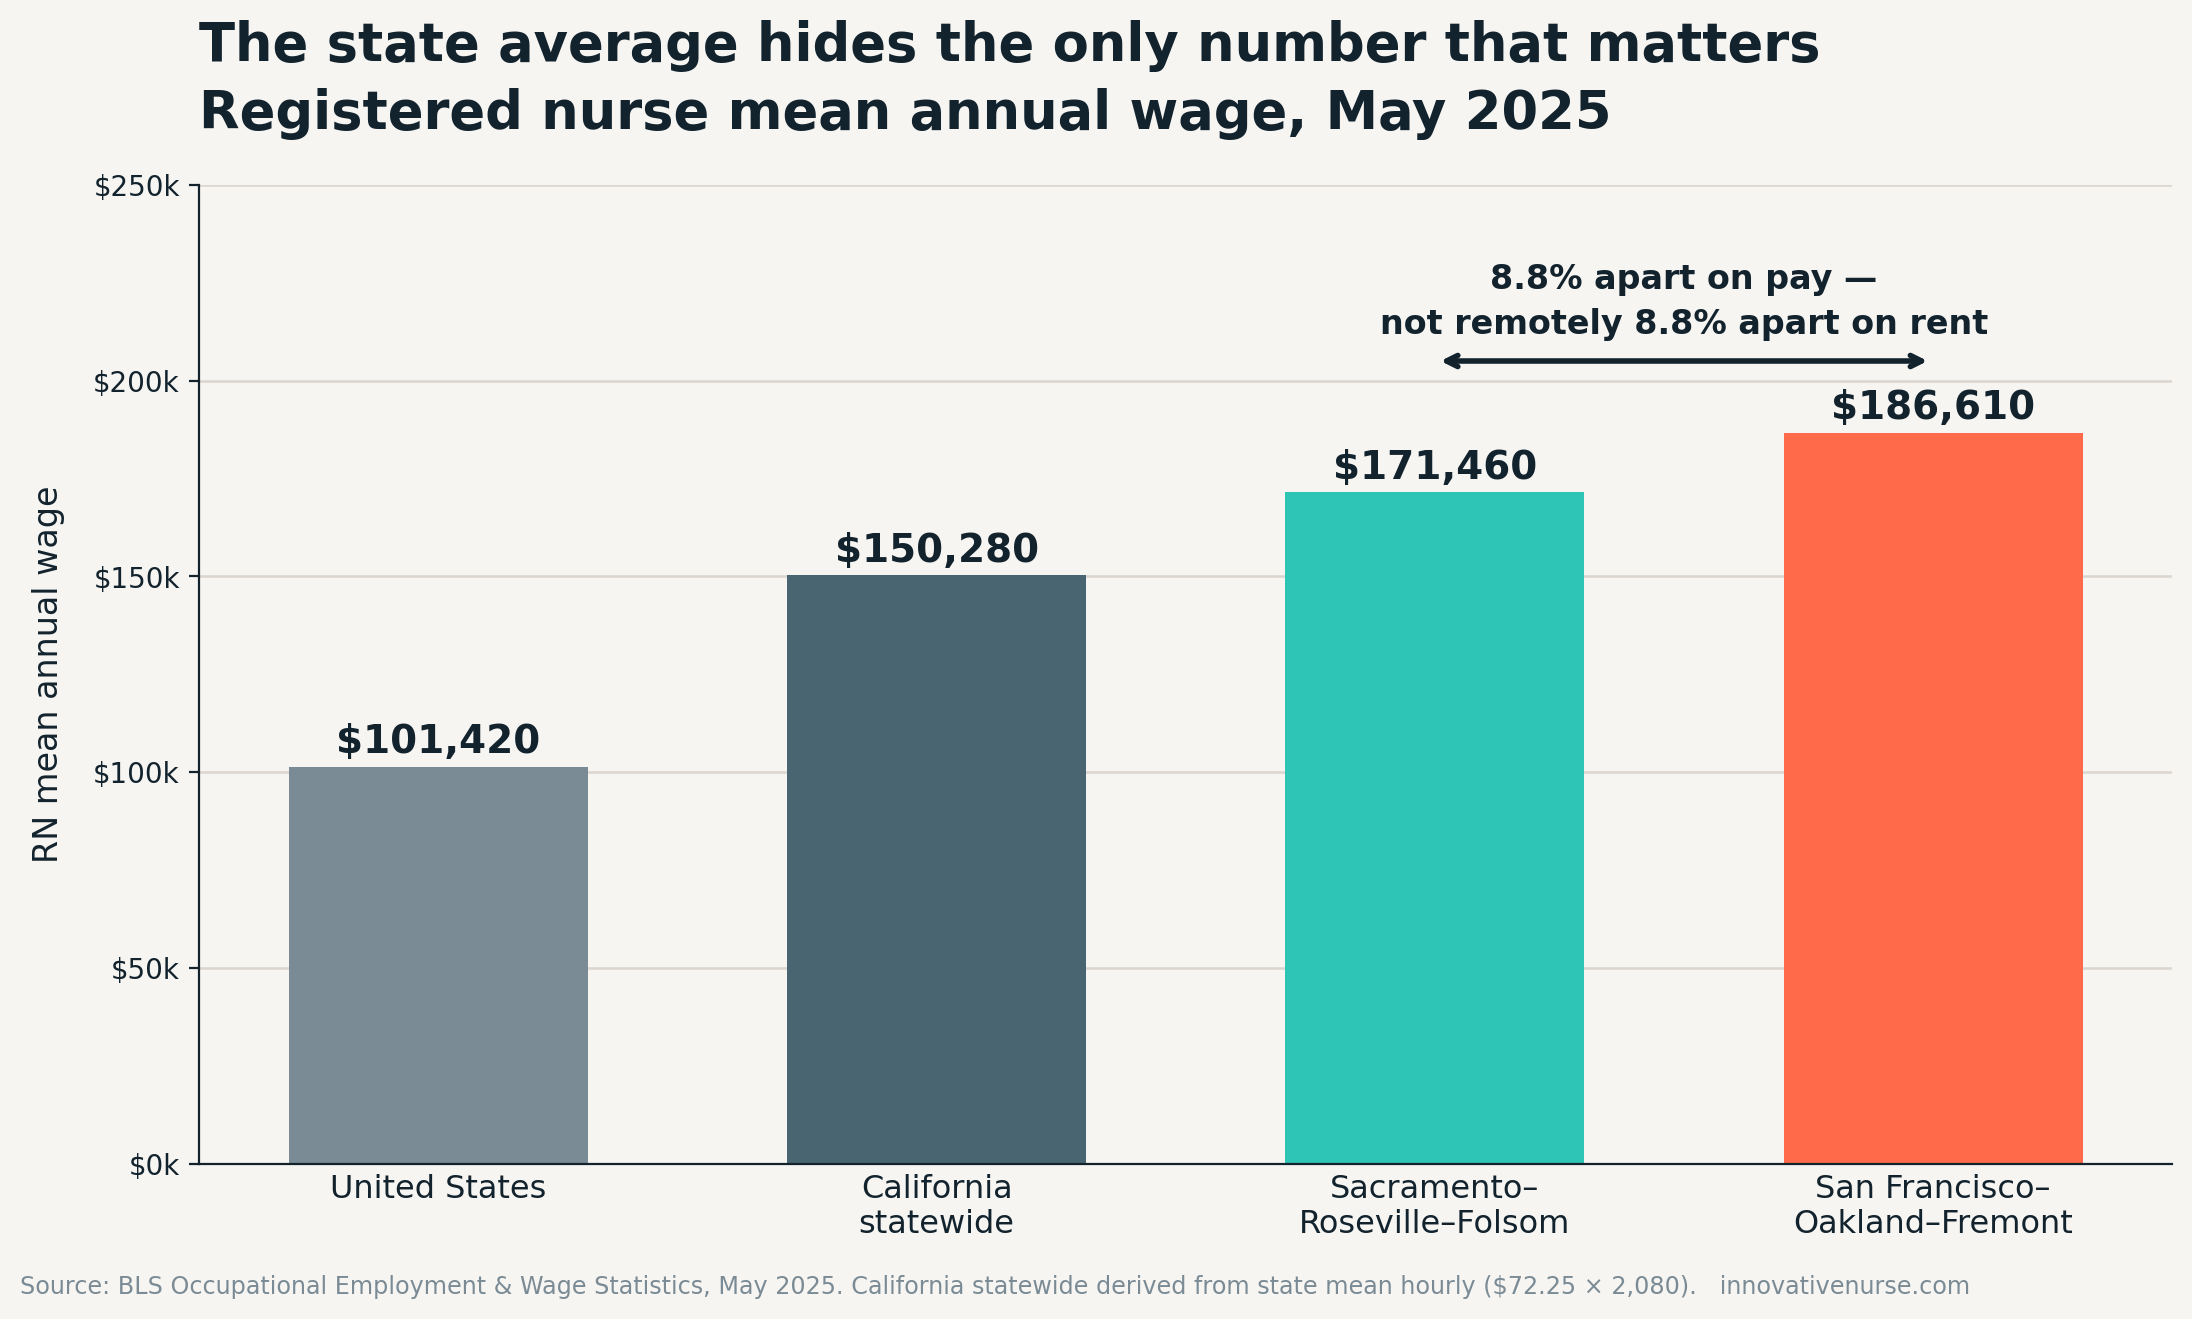
Per the BLS May 2025 wage data:
| Area | RN mean annual wage |
|---|---|
| United States | $101,420 |
| California, statewide | $150,280 |
| Sacramento–Roseville–Folsom | $171,460 |
| San Francisco–Oakland–Fremont | $186,610 |
Two things should jump out.
First, the statewide California figure describes almost nobody. It sits $21,000 below Sacramento and $36,000 below the Bay. Anyone making a life decision off a state average is working from a number that is not their market.
Second, San Francisco pays 8.8% more than Sacramento. Not 40%. Not double. Under nine percent.
Nobody thinks Bay Area housing costs 8.8% more than Sacramento housing.
That gap between how little nursing wages move across a region and how much housing costs move across the same region is the arbitrage. It is not a secret, it is not a loophole, and it is available to anyone willing to drive.
Why nursing pay is sticky when housing is not
Most occupations get priced locally. Nursing frequently does not, for three structural reasons:
- System-wide scales. Large health systems often run one pay scale across many facilities in a region, so a hospital in a cheap suburb pays close to the flagship downtown rate.
- Union contract geography. A single collective bargaining agreement can cover facilities across an enormous cost-of-living range. Every nurse under it gets the same steps.
- Recruitment floors. Hospitals in lower-cost areas still compete against metro employers for the same finite pool of licensed nurses, so they cannot drift too far below metro rates without losing staff.
The result: your wage is set by the labor market geography, and your expenses are set by your ZIP code geography. Those two maps are not the same map. Every dollar of daylight between them is yours to claim.
The clearest illustration in the federal data
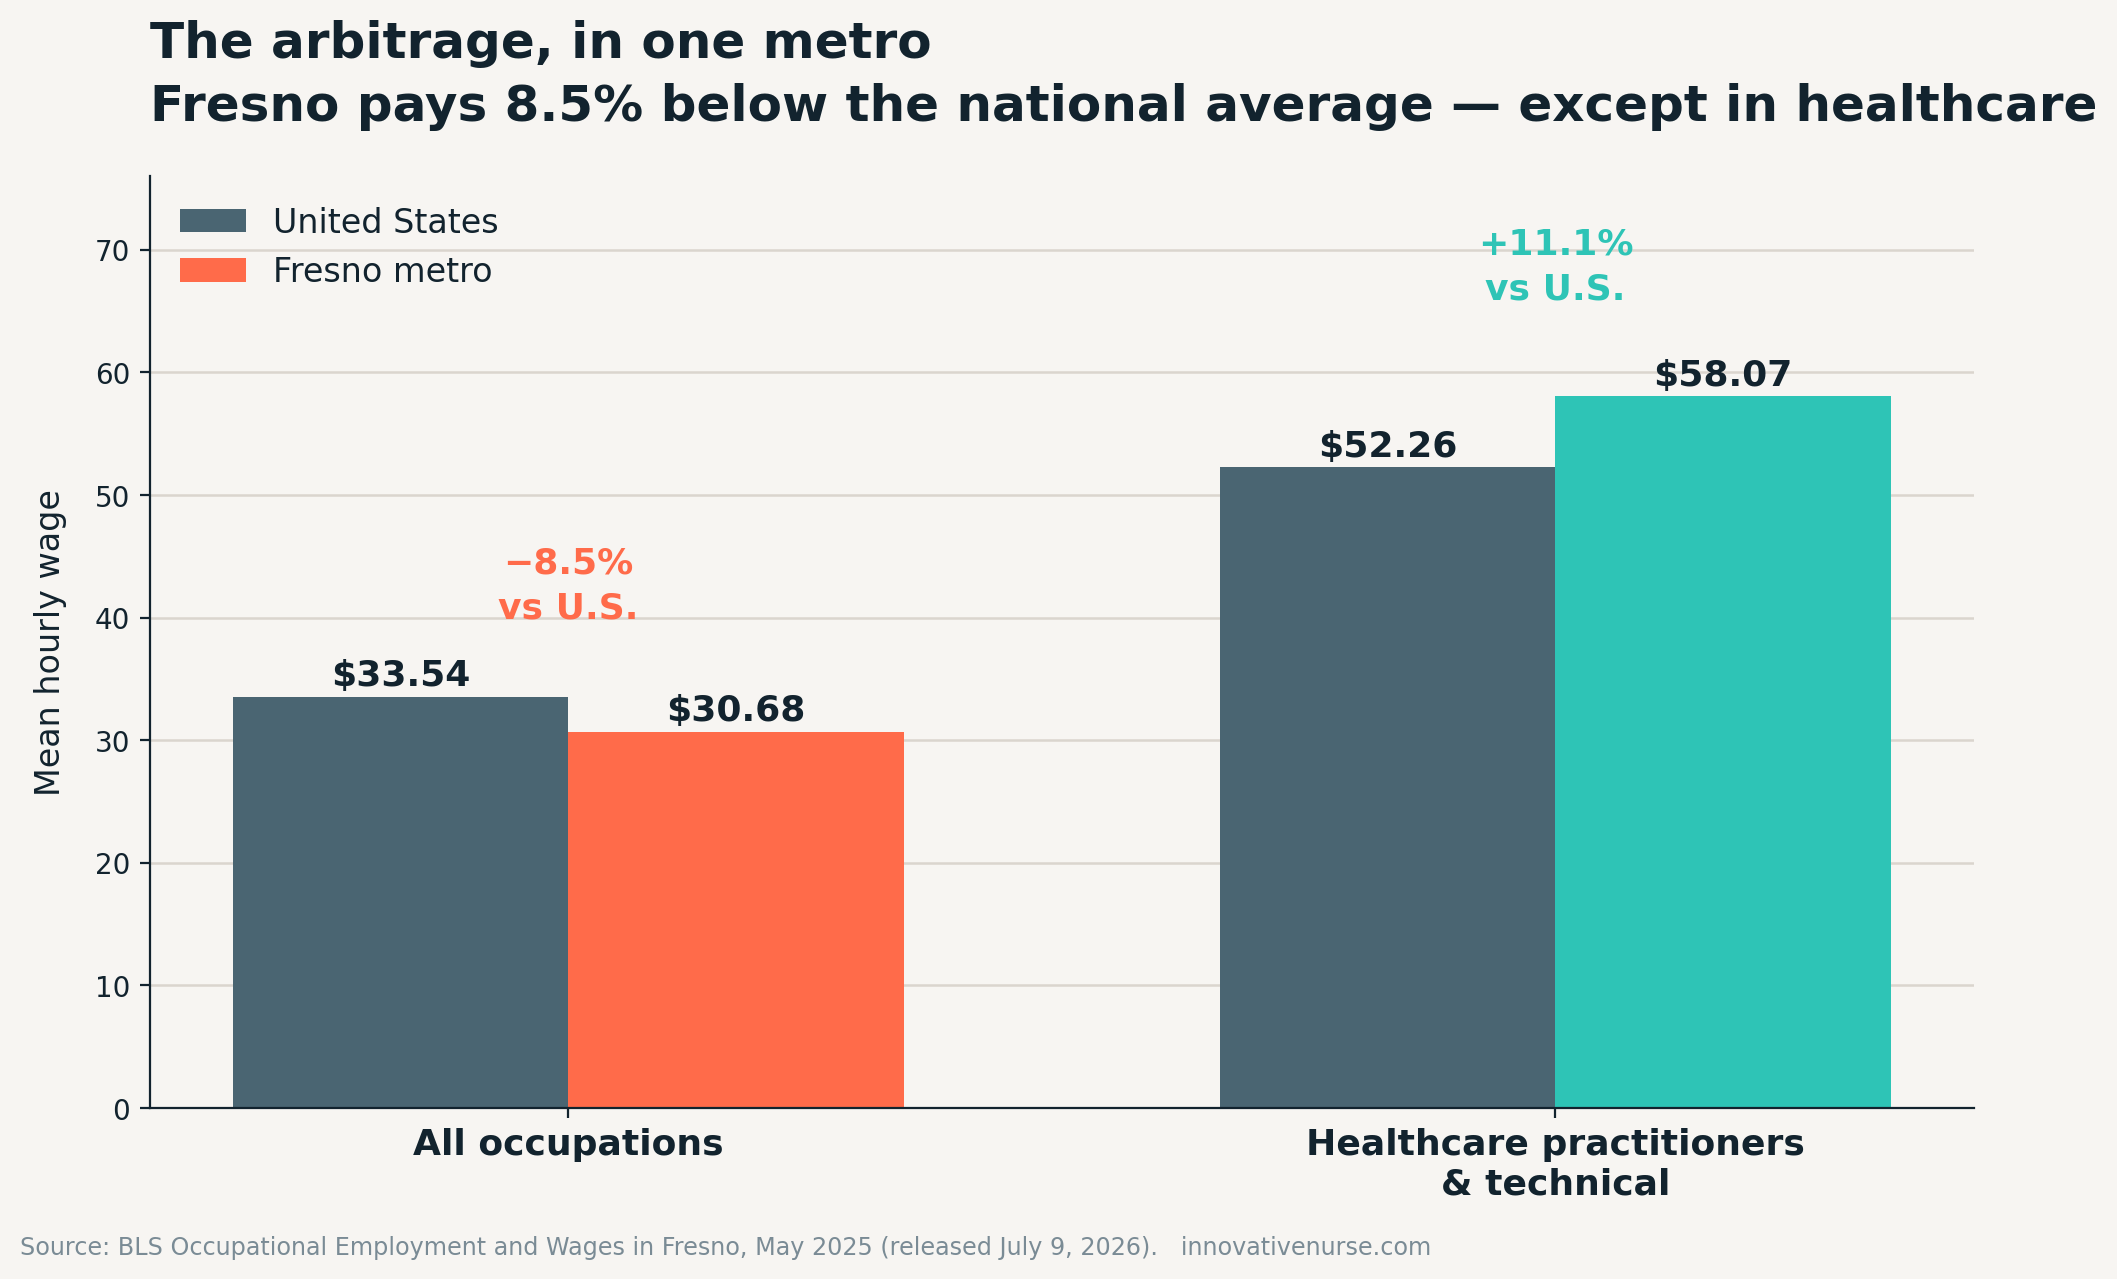
Look at the Fresno metro in the May 2025 release. Across all occupations, Fresno mean hourly pay is $30.68 versus $33.54 nationally. The metro pays about 8.5% below the U.S. average, which tracks with it being a lower-cost place to live.
Now look at healthcare practitioners and technical occupations specifically: $58.07 in Fresno versus $52.26 nationally, 11.1% above the U.S. average.
Same metro. Same month. Same survey. The general labor market prices below national; the clinical labor market prices above it. A nearly 20-point swing between what the metro pays everyone and what it pays clinicians.
That is what regional pay-setting looks like when it collides with local cost of living. And it is the mechanism behind every story you have ever heard a nurse tell about making metro money while paying small city rent.
The part that will annoy you
Here is the frustrating part. You would want to check this systematically: pull the official price level for each metro, divide, rank them.
You can’t do this anymore.
With the 2024 data release, the Bureau of Economic Analysis discontinued Regional Price Parities for metropolitan statistical areas. The state-level series continues. The metro level series, the one that would let any nurse in the country compute exactly this; is gone.
So the single most valuable comparison in nursing compensation is now the one comparison no federal dataset will hand you. You have to build it yourself.
It takes about twenty minutes.
Build your own metro number
- Get your metro RN wage, not your state wage. BLS publishes OEWS estimates for over 500 areas. Find your MSA. Record the median and the 75th percentile.
- Get the wage for every metro within commuting range. This is the step everyone skips and it is where the money is. Check the expensive metro next door.
- Find out how far the scale reaches. Ask the employer directly which facilities share the pay scale, and ask the union which facilities the contract covers. A scale that extends into a cheap housing market is worth more than a raise.
- Price housing at the ZIP you would actually live in, not the metro average. Metro averages blend the expensive core with the affordable edge, which defeats the purpose.
- Subtract the commute, honestly. Mileage, tolls, vehicle wear, and the fact that a 60-minute drive after a twelve is not free. Price it, then decide if the spread still clears.
- Check the tax line. Interstate commuters especially — a metro that straddles a state border can change your effective rate meaningfully.
Then compare real numbers, in writing, side by side.
The Ask
The question that gets you the information nobody volunteers:
Which facilities are on this same pay scale, and how far does the contract coverage area extend? I am deciding where to live, not just where to work.
Recruiters answer this readily. It is not sensitive, and most have never been asked. What you are doing is finding the cheapest point on the map where the expensive scale still applies.
The bottom line
Ranking the states was step one, and it is still worth doing. But if you stop there, you will relocate across the country to capture a spread you could have captured with a forty-minute drive.
The offer letter tells you what the job pays. It does not tell you where that pay goes furthest — and as of this year, no federal dataset will either.
Run the numbers in the Stay-or-Pivot calculator and compare your current market against the one next door before you sign anything or pack anything.
Want the next one of these before it hits the blog? Get on the Career Leverage Newsletter.
Never just the status quo.
Methodology and sources
- Wages: BLS Occupational Employment and Wage Statistics, May 2025 (released May 15, 2026). Metro figures from the BLS regional news releases for San Francisco–Oakland–Fremont and Fresno.
- California statewide annual figure derived from the state RN mean hourly wage of $72.25 times 2,080 hours.
- Metro price data discontinuation: BEA, Regional Price Parities by State and Metro Area.
- Metro means include all RNs in the area, including higher-paid specialty and leadership roles. A mean is not an offer.
Hello.
Hello.