
Every few weeks a nurse posts a paystub and the Internet seems to go sideways. A three-figure hourly rate, a fat gross number, and then the comment section splits into the same three camps every time.
- “That’s only good money because it’s California.”
- “Cool, now show us the deductions.”
- “After that many years you should be making more.”
All three camps are reacting to the same problem. The number on the paystub is the number you earn. It isn’t the number you keep, and it definitely isn’t what that money buys where you live.
Back in July we ran what a nurse’s paycheck is really worth in all 50 states, adjusting median RN pay for local prices. California came out on top even after cost of living took its cut. But we flagged one big thing that analysis left out: taxes. So this is the follow-up. Same wage data, same price index, and now the IRS and your state get their share first.
The setup: one nurse, seven states
To keep it apples to apples, we used one simple nurse profile and ran it through seven states that show up constantly in nurse pay arguments:
- Earns the state median RN salary (BLS, the same figures we used in July).
- Files single and takes the standard deduction.
- Puts 6% into a pre-tax 401(k), which is close to a typical match-capturing contribution.
- Pays 2026 federal income tax, Social Security and Medicare, state income tax, and any mandatory state payroll programs (California SDI, Oregon transit tax and Paid Leave, Washington PFML and WA Cares, New York PFL and DI).
Then we took what’s left and adjusted it for local prices using BEA Regional Price Parities. That gives you two numbers per state: the cash that actually lands in your account, and what that cash is worth in buying power.
The results: California’s crown slips
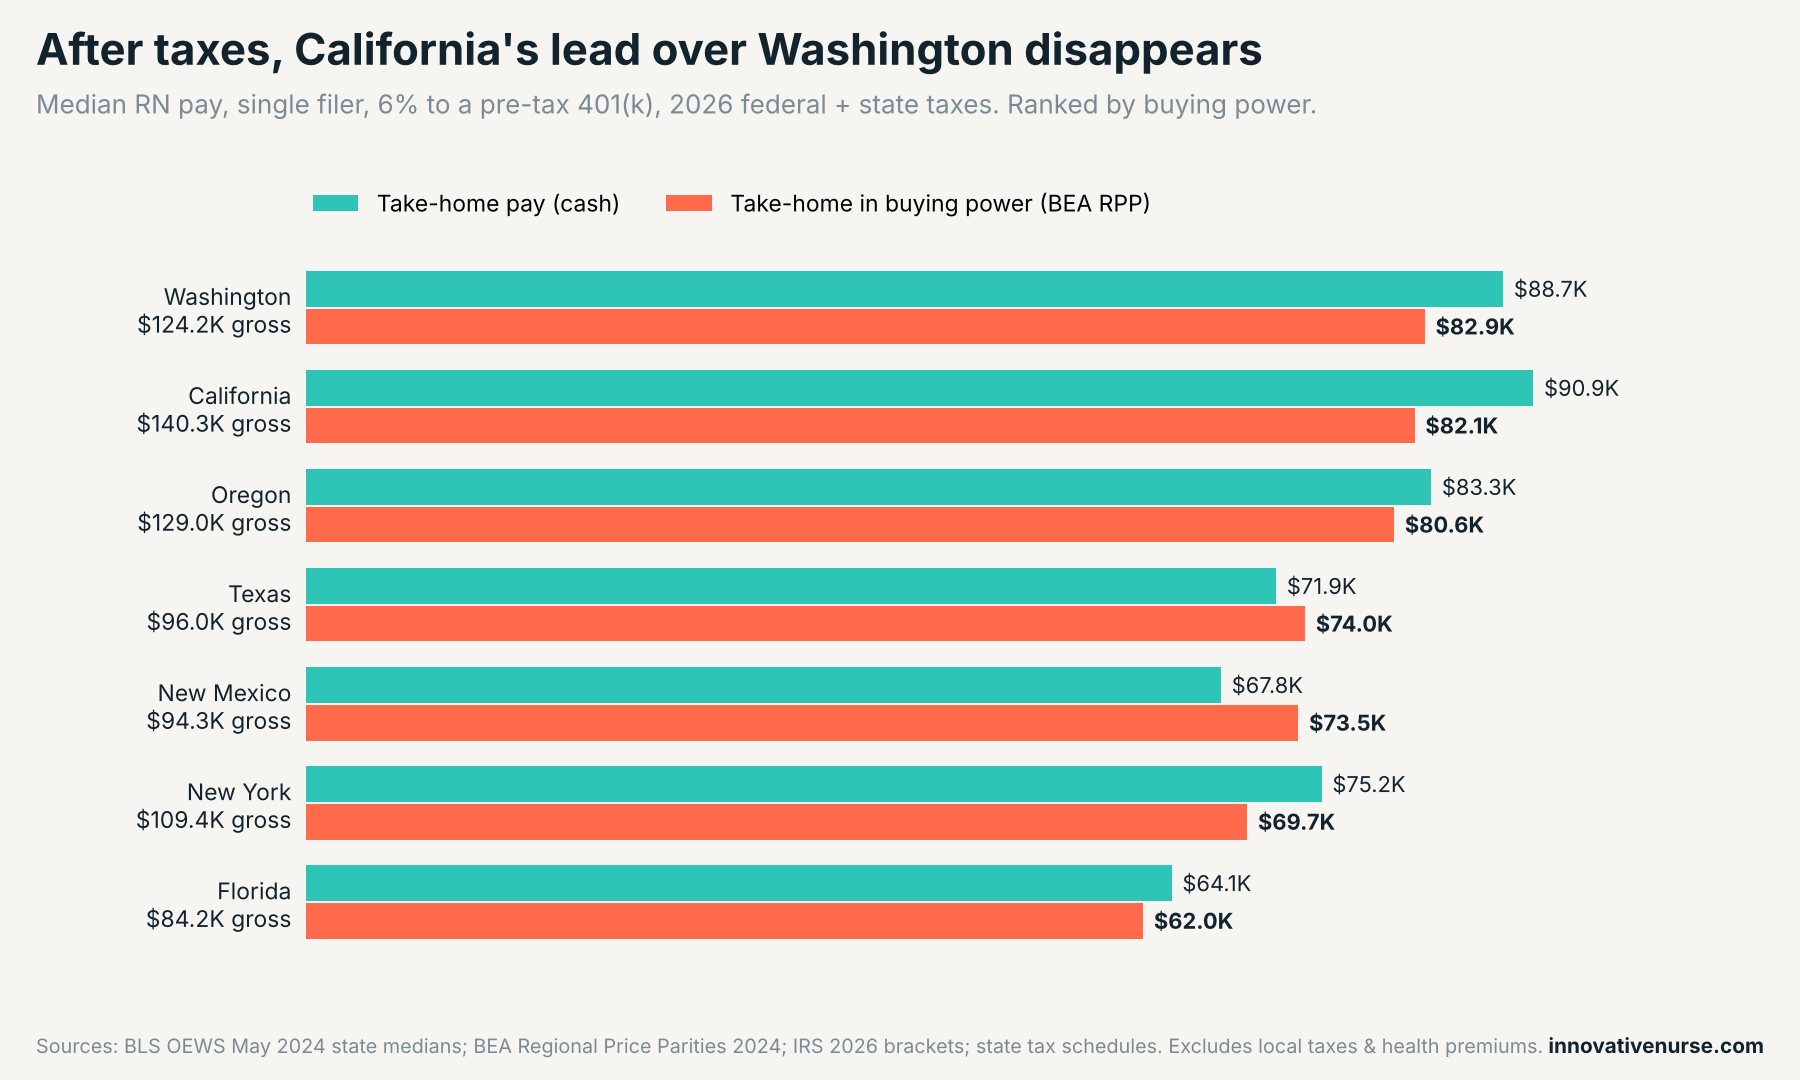
| State | Median gross | Take-home (cash) | % of gross kept | Take-home buying power |
|---|---|---|---|---|
| Washington | $124,200 | $88,669 | 71.4% | $82,868 |
| California | $140,270 | $90,903 | 64.8% | $82,117 |
| Oregon | $129,010 | $83,339 | 64.6% | $80,598 |
| Texas | $95,970 | $71,853 | 74.9% | $73,999 |
| New Mexico | $94,340 | $67,769 | 71.8% | $73,502 |
| New York | $109,440 | $75,227 | 68.7% | $69,719 |
| Florida | $84,190 | $64,118 | 76.2% | $62,009 |
Three things jump out.
1. California’s $16,000 gross lead over Washington is gone
On paper, the median California nurse out-earns the median Washington nurse by about $16,000. After taxes, the gap in cash shrinks to roughly $2,200. After prices, Washington pulls ahead by about $750. Washington has no state income tax. On the Washington median salary, California’s income tax would cost about $6,600 a year. In July California was the clear winner. Once taxes count, it’s a tie at best.
2. Texas passes New York
New York pays its median nurse about $13,500 more than Texas does. After taxes and prices, the Texas nurse comes out about $4,300 ahead. Bigger gross, smaller life. That’s the trap the paystub posts don’t capture.
3. Florida is still last, and taxes can’t save it
Florida nurses keep the highest share of their gross of any state here (76%) because there’s no state income tax. It doesn’t matter. The starting number is too low and prices are above the national average. Even with the friendliest tax treatment on the board, Florida finishes last in buying power. The gross gap between California and Florida is about $56,000. In after-tax buying power it’s about $20,000. Still real money, but nowhere near what the raw numbers suggest.
Where the money actually goes
Here’s the paystub breakdown the comment section keeps asking for, using the median California nurse.
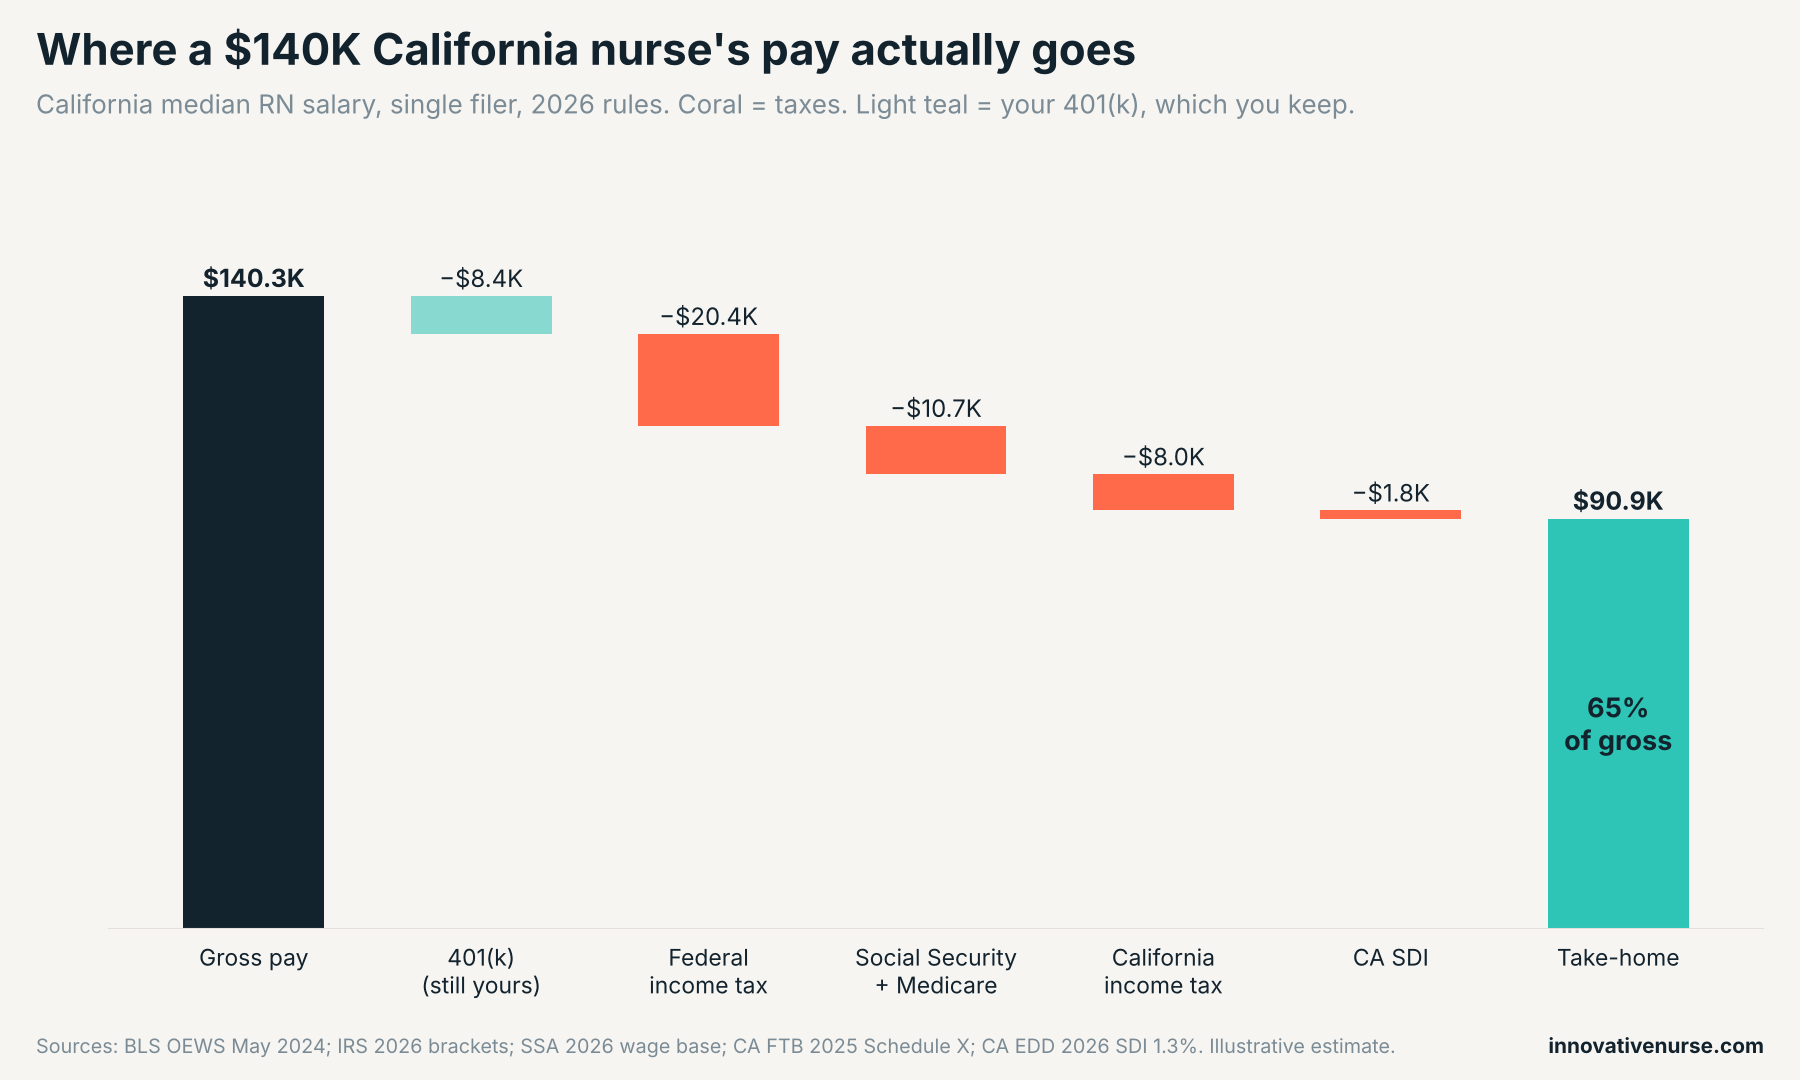
Out of $140,270 gross, about $90,900 hits the bank. Federal income tax is the biggest bite at about $20,400. Social Security and Medicare take another $10,700. California takes about $8,000 in income tax plus $1,800 for SDI, which has no wage cap, so it scales with every dollar you earn.
The $8,400 401(k) contribution is the one deduction that isn’t a loss. It’s still your money, just in a different account. If someone tells you a nurse “only takes home 65%,” ask whether they’re counting the retirement savings as gone. Counting it, this nurse keeps about 71% of what she earns.
The $124-an-hour question
The viral paystubs usually aren’t median nurses. They’re experienced nurses in high-paying markets. So we ran one more scenario: $124.57 an hour, full time (2,080 hours, about $259,000 a year).
| State | Take-home (cash) | % of gross kept |
|---|---|---|
| Texas / Florida | $178,588 | 68.9% |
| Washington | $175,596 | 67.8% |
| New York | $164,624 | 63.5% |
| California | $156,814 | 60.5% |
| Oregon | $155,138 | 59.9% |
Same rate, a $21,800 difference in cash between California and Texas. The higher you climb, the more your state’s tax code matters, because you’re paying top marginal rates on more of your income. At this pay level, federal income tax alone is about $49,000.
To be clear, $124 an hour in Texas isn’t a common offer. That’s the whole point. A rate is only “good” relative to the taxes and prices that come with it.
The decision: stop comparing rates, start comparing lives
Here’s the reframe. “How much do you make?” is the wrong question. The useful question is: what does my license buy me after taxes, in the place I actually want to live?
Before you take the offer, ask for the raise, or start browsing jobs three states away, run this checklist:
- Convert the offer to annual gross. Hourly rate × your real scheduled hours. A 36-hour week is 1,872 hours a year, not 2,080.
- Subtract taxes for that specific state. Federal is the same everywhere. State income tax ranges from zero to over 9% at nurse incomes. Don’t forget mandatory payroll programs like California SDI.
- Add back what you’d save. 401(k) contributions and employer match are part of your compensation. Compare the match, not just the rate.
- Subtract health premiums. We left these out because they vary so much by employer, but they can run thousands of dollars a year. Get the real number from HR.
- Adjust for prices. Divide take-home by the state’s price level (RPP ÷ 100). Then look at actual rent listings in your target city, because statewide averages hide a lot (more on that in our post on why your state average is lying to you).
- Compare the result, not the rate. If the “raise” disappears after steps 2 to 5, it isn’t a raise.
Or skip the spreadsheet. The Stay-or-Pivot Calculator lets you plug in your current pay, a target offer, and your real expenses so you can see what a move or a raise is actually worth before you commit to anything.
One tax break worth knowing about if you work overtime
From 2025 through 2028, there’s a new federal deduction for qualified overtime pay. If your overtime meets the federal FLSA definition, you can deduct the premium portion (the extra “half” in time-and-a-half) up to $12,500 a year if you’re single, phasing out above $150,000 of modified AGI. It reduces federal income tax only, not Social Security, Medicare, or most state taxes. Check the IRS guidance or a tax pro before you count on it. It isn’t included in the numbers above.
Bottom line
The paystub is a vanity number. Take-home is the real number. Take-home adjusted for where you live is the number that decides your life. Nurses who know their third number negotiate better, move smarter, and stop getting played by headline rates.
Run yours in the Stay-or-Pivot Calculator. Never just the status quo.
Methodology & sources
- Wages: BLS Occupational Employment and Wage Statistics, May 2024, median annual wage for registered nurses by state. These are the same figures used in our July 2026 state comparison so the two posts line up.
- Prices: BEA Regional Price Parities, all items, by state, 2024 (released February 2026). Buying power = take-home ÷ (RPP ÷ 100).
- Federal income tax: 2026 brackets and $16,100 single standard deduction, per the IRS inflation adjustments (CPA Practice Advisor, Oct. 9, 2025).
- Social Security and Medicare: 6.2% up to the 2026 wage base of $184,500 (Journal of Accountancy), plus 1.45% Medicare and the 0.9% additional Medicare tax above $200,000.
- California: FTB 2025 Schedule X, $5,706 standard deduction, $153 personal exemption credit; SDI at 1.3% with no wage cap (EDD 2026 rates via Bloomberg Tax).
- Oregon: 2025 brackets (4.75% to 9.9%), $2,835 standard deduction, federal tax subtraction up to $8,500 (Oregon quick reference, TaxAct); 0.1% statewide transit tax and 0.6% Paid Leave Oregon (National Tax Tools).
- New York: 2025 bracket thresholds with the 0.1-point 2026 rate cut on the lower brackets (CPA Journal, NerdWallet), $8,000 standard deduction; PFL at 0.432% up to $411.91 (NY DFS); DI at $0.60/week. Excludes New York City and Yonkers local tax.
- New Mexico: 2025 brackets (1.5% to 5.9%) with the federal standard deduction (TaxAct).
- Washington: no income tax; PFML employee share of about 0.81% up to the Social Security wage base and WA Cares at 0.58% with no cap (National Tax Tools).
- Texas and Florida: no state income tax or mandatory employee payroll programs modeled.
Caveats
- Medians aren’t offers. Your pay depends on experience, specialty, shift, and employer.
- Statewide figures hide metro spread. Prices in Seattle, the Bay Area, or New York City run well above their state’s average.
- Single filer only. Married filing jointly, dependents, and itemized deductions change the math.
- Not modeled: health premiums, local income taxes, overtime, differentials, and the new overtime deduction.
- State tax years: several states hadn’t published 2026 schedules yet, so we used their 2025 schedules (noted above). Expect small differences.
- This is education, not tax advice. Talk to a tax professional about your own situation.
EDITOR NOTES (delete before publishing)
- Hook paraphrases the high-engagement Instagram paystub discussions (Sept 2026). No usernames or verbatim comments used. Keep it that way.
- Internal links: July ‘What a Nurse’s Paycheck Is Really Worth’ (5525), ‘Your State Average Is Lying To You Too’ (5552). Consider adding a link back to this post from 5525’s taxes caveat.
- Verify before publishing: the NY 2026 rate cut (we applied ?0.1 pt to the lower brackets) and Oregon/NM using 2025 schedules.
- Wage data deliberately kept at BLS May 2024 for consistency with post 5525. If you’d rather move both posts to the May 2025 OEWS release, the charts and table need regenerating.
- Featured image = title card (5592). Category = Pay.