
You’ve seen the table. It’s making the rounds again: median RN pay by state, California sitting on top at $140,270, Alabama and Mississippi at the bottom around $77,000. And you’ve seen the comment section too, because it’s the same argument every time:
“Yeah, but cost of living.”
“But then you have to live in Alabama…”
Both sides are half right, and neither one is giving you a number you can actually use. So let’s do what nobody in the comments ever does: run the math.
The setup
The Bureau of Labor Statistics publishes median RN wages by state. The Bureau of Economic Analysis publishes Regional Price Parities (RPPs), a measure of how much everything costs in each state compared to the national average (100 = average; California is 110.7, Arkansas is 86.9).
Divide the salary by the price level, and you get what economists call real buying power: what that paycheck is worth where you actually live. Here’s what happens to the rankings when you do.
The headline nobody in the comments wants to hear
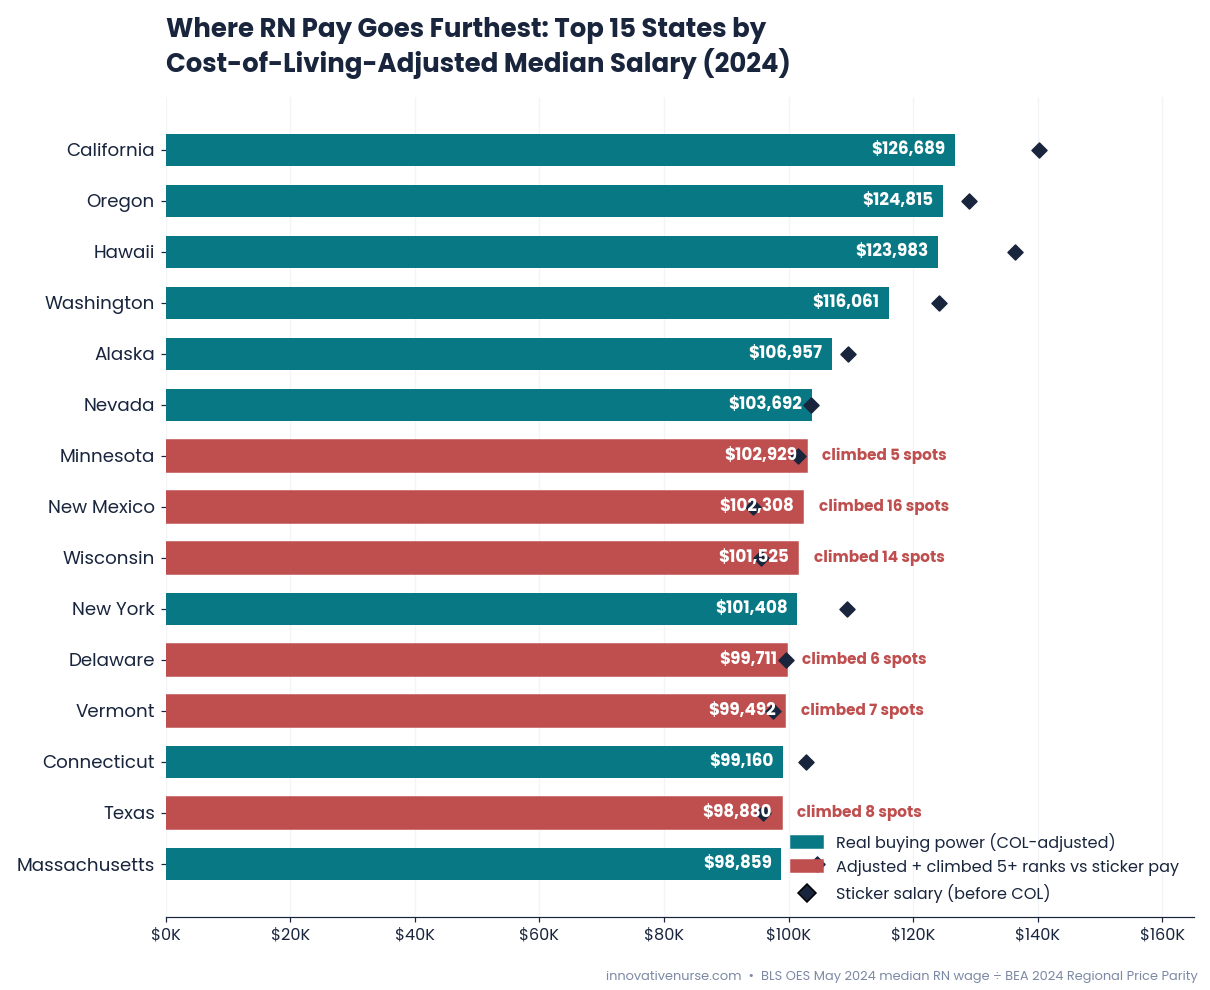
California survives the adjustment. Even after the most expensive cost of living in the country takes its cut, California’s median RN salary is still worth $126,689, the best in the nation. The “it all evaporates in rent” argument is a vent, not a fact. The premium shrinks by about $13,600, but it doesn’t disappear.
The entire West Coast holds: California, Oregon, Hawaii, and Washington are the top four whether you adjust or not. Oregon is arguably the sleeper. It pays $129K sticker, and the state’s price level is barely above average, so nearly all of it survives.
But the middle of the table gets shuffled hard. That’s where the real story is.
The winners you weren’t looking at
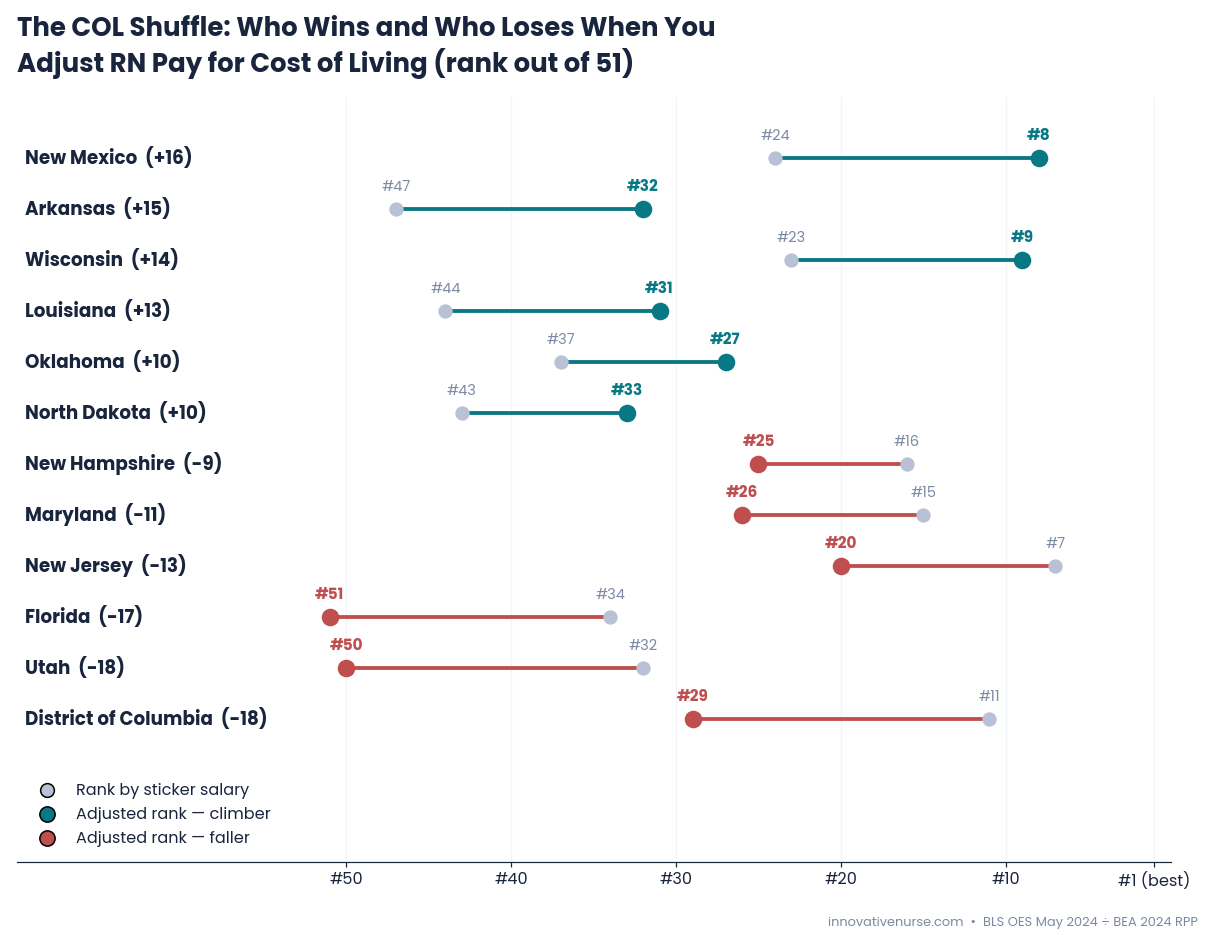
- New Mexico climbs 16 spots, from #24 to #8. A $94,340 median salary in a state priced 8% below the national average is worth over $102,000 in buying power. That’s effectively New York money without New York rent.
- Wisconsin climbs 14 spots into the top 10 ($95,530 sticker to $101,525 adjusted).
- Texas quietly lands at #14 adjusted, with nearly $99K in real value and no state income tax on top (more on taxes below).
- Arkansas, Louisiana, Oklahoma, North Dakota all jump 10+ spots. The “low-pay South” is partly a pricing illusion.
The losers hiding in plain sight
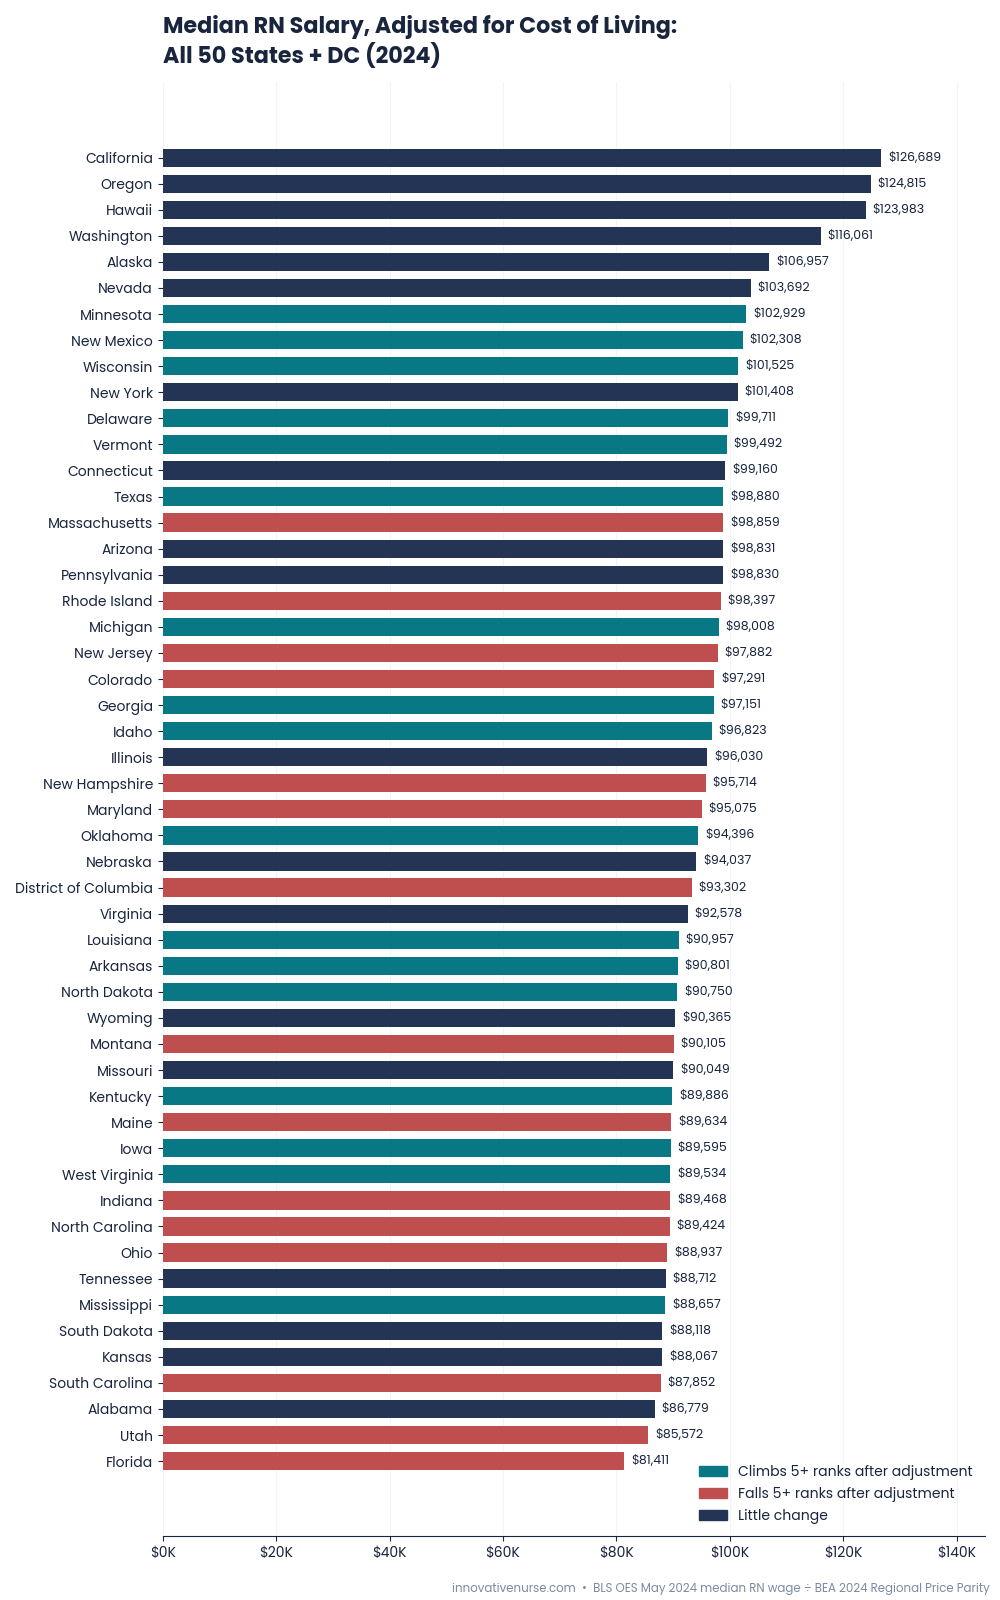
- Florida is dead last. Not close to last. Last, at $81,411 adjusted. Mid-pack sticker pay ($84,190) meets 3.4%-above-average prices, and the sunshine tax eats the whole thing. If you’re a Florida nurse feeling underpaid, you’re not imagining it. You have the worst real median pay in America.
- Utah falls 18 spots to #50. Wages never caught up to what happened to housing along the Wasatch Front.
- DC falls 18 spots. New Jersey falls 13. Maryland falls 11. The commuter-belt states pay coastal prices without paying coastal wages.
The full table
| Rank | State | Sticker salary | RPP (2024) | Adjusted value | Sticker rank | Move |
|---|---|---|---|---|---|---|
| 1 | California | $140,270 | 110.7 | $126,689 | 1 | — |
| 2 | Oregon | $129,010 | 103.4 | $124,815 | 3 | +1 |
| 3 | Hawaii | $136,320 | 110.0 | $123,983 | 2 | -1 |
| 4 | Washington | $124,200 | 107.0 | $116,061 | 4 | — |
| 5 | Alaska | $109,480 | 102.4 | $106,957 | 5 | — |
| 6 | Nevada | $103,670 | 100.0 | $103,692 | 9 | +3 |
| 7 | Minnesota | $101,510 | 98.6 | $102,929 | 12 | +5 |
| 8 | New Mexico | $94,340 | 92.2 | $102,308 | 24 | +16 |
| 9 | Wisconsin | $95,530 | 94.1 | $101,525 | 23 | +14 |
| 10 | New York | $109,440 | 107.9 | $101,408 | 6 | -4 |
| 11 | Delaware | $99,520 | 99.8 | $99,711 | 17 | +6 |
| 12 | Vermont | $97,460 | 98.0 | $99,492 | 19 | +7 |
| 13 | Connecticut | $102,740 | 103.6 | $99,160 | 10 | -3 |
| 14 | Texas | $95,970 | 97.1 | $98,880 | 22 | +8 |
| 15 | Massachusetts | $104,550 | 105.8 | $98,859 | 8 | -7 |
| 16 | Arizona | $99,500 | 100.7 | $98,831 | 18 | +2 |
| 17 | Pennsylvania | $96,430 | 97.6 | $98,830 | 20 | +3 |
| 18 | Rhode Island | $100,640 | 102.3 | $98,397 | 13 | -5 |
| 19 | Michigan | $94,300 | 96.2 | $98,008 | 25 | +6 |
| 20 | New Jersey | $106,500 | 108.8 | $97,882 | 7 | -13 |
| 21 | Colorado | $100,260 | 103.1 | $97,291 | 14 | -7 |
| 22 | Georgia | $93,550 | 96.3 | $97,151 | 27 | +5 |
| 23 | Idaho | $92,460 | 95.5 | $96,823 | 28 | +5 |
| 24 | Illinois | $95,990 | 100.0 | $96,030 | 21 | -3 |
| 25 | New Hampshire | $99,700 | 104.2 | $95,714 | 16 | -9 |
| 26 | Maryland | $99,790 | 105.0 | $95,075 | 15 | -11 |
| 27 | Oklahoma | $82,920 | 87.8 | $94,396 | 37 | +10 |
| 28 | Nebraska | $84,730 | 90.1 | $94,037 | 31 | +3 |
| 29 | District of Columbia | $102,540 | 109.9 | $93,302 | 11 | -18 |
| 30 | Virginia | $93,600 | 101.1 | $92,578 | 26 | -4 |
| 31 | Louisiana | $80,230 | 88.2 | $90,957 | 44 | +13 |
| 32 | Arkansas | $78,940 | 86.9 | $90,801 | 47 | +15 |
| 33 | North Dakota | $80,730 | 89.0 | $90,750 | 43 | +10 |
| 34 | Wyoming | $83,760 | 92.7 | $90,365 | 35 | +1 |
| 35 | Montana | $85,280 | 94.6 | $90,105 | 30 | -5 |
| 36 | Missouri | $81,780 | 90.8 | $90,049 | 40 | +4 |
| 37 | Kentucky | $81,040 | 90.2 | $89,886 | 42 | +5 |
| 38 | Maine | $86,990 | 97.0 | $89,634 | 29 | -9 |
| 39 | Iowa | $78,630 | 87.8 | $89,595 | 48 | +9 |
| 40 | West Virginia | $80,130 | 89.5 | $89,534 | 45 | +5 |
| 41 | Indiana | $83,500 | 93.3 | $89,468 | 36 | -5 |
| 42 | North Carolina | $84,350 | 94.3 | $89,424 | 33 | -9 |
| 43 | Ohio | $82,510 | 92.8 | $88,937 | 38 | -5 |
| 44 | Tennessee | $81,500 | 91.9 | $88,712 | 41 | -3 |
| 45 | Mississippi | $77,090 | 87.0 | $88,657 | 50 | +5 |
| 46 | South Dakota | $78,060 | 88.6 | $88,118 | 49 | +3 |
| 47 | Kansas | $79,320 | 90.1 | $88,067 | 46 | -1 |
| 48 | South Carolina | $82,360 | 93.7 | $87,852 | 39 | -9 |
| 49 | Alabama | $77,080 | 88.8 | $86,779 | 51 | +2 |
| 50 | Utah | $84,600 | 98.9 | $85,572 | 32 | -18 |
| 51 | Florida | $84,190 | 103.4 | $81,411 | 34 | -17 |
Before you load the U-Haul: three honest caveats
- These are statewide medians. “California” is both a Bay Area ICU paying $180K and a rural hospital paying half that, and Southern California pays significantly less than Northern. Same logic in reverse: Seattle skews Washington’s costs up while wages in Spokane stretch further than the state number suggests.
- Taxes aren’t in these numbers. RPP measures prices, not taxes. Texas, Washington, Nevada, Florida, Alaska, and a few others have no state income tax, which is worth roughly $4,000 to $9,000 a year at RN incomes versus a high-tax state. That pushes Washington and Texas up further and softens California’s win.
- The median is not your offer. New grads sit well below the median; a 20-year ICU veteran with certifications sits above it. Use these numbers to compare states, not to predict your paycheck.
The actual decision
Here’s the reframe: the question was never “which state pays the most?” It’s “where does my license buy the life I want?”
A $102K-equivalent salary in New Mexico with a 15-minute commute and a mortgage under $2,000 beats a $126K-equivalent in California if the California version comes with a 90-minute commute and a landlord. Or it doesn’t, because career ceilings, union strength, and ratios (California is still the only state with mandated ratios) are worth real money too. That’s a personal equation, not a spreadsheet answer.
Run your own numbers in the Stay-or-Pivot Calculator. Plug in your current pay, your target state, and your actual expenses, and see what a move is really worth before you commit to anything.
And if you want the next breakdown like this before it hits the blog, get on the Career Leverage Newsletter. Never just the status quo.
Methodology & sources
- Wages: BLS Occupational Employment and Wage Statistics, May 2024: median RN annual wage by state (as reported by Becker’s Hospital Review, July 2026).
- Cost of living: BEA Regional Price Parities, All Items, by state, 2024 (released February 19, 2026).
- Calculation: adjusted value = median annual wage ÷ (RPP ÷ 100). Ranks out of 51 (50 states + DC).